ANSI-C program: stacking.c
NAME
stacking - Stacking of multiple unwrapped differential
interferometric phases to estimate deformaton rate in units of
radians/year
SYNOPSIS
stacking <diff_tab> <width> <ph_rate>
  <sig_ph_rate> <sig_ph> <roff> <loff> [nr]
  [nl] [np_min] [tscale]
| data_tab | (input) 2 column list of unwrapped differential
interferograms and delta_T values in days (text) |
| <width> | number of samples/line of the interferograms in the
stack |
| <ph_rate> | (output) average phase rate determined from a weighted
sum of phases (radians/year, float) |
| <sig_ph_rate> |
(output) standard deviation of the estimated phase rate
(radians/year, float) |
| <sig_ph> | (output) standard deviation of the residual phases (enter - for none, radians, float) |
| [roff] | range pixel offset to center of the phase reference
region |
| [loff] |
line offset to center of
the phase reference region |
| [nr] | number of range pixels to average in the phase reference region (enter - for default: 16) |
| [nl] | number of lines average in the phase reference region (enter - for default: 16) |
| [np_min] |
min. number of phase values required to accept phase
rate estimate (enter - for default = nfiles) |
| [tscale] |
time scale used for phase
rate calculation (enter - for default): 0: radians/day 1: radians/year (default) |
EXAMPLE:
stacking diff_tab
  600 ph_rate ph_rate_sigma ph_sigma 148 304 8 8
  9
20030404_20020924.adf.unw -192

  20030404_20021018.adf.unw -168

  20030404_20021111.adf.unw -144

  20030404_20021229.adf.unw  -96

  20030404_20030122.adf.unw  -72

  20030404_20030311.adf.unw  -24

  20030404_20030428.adf.unw   24

  20030404_20030522.adf.unw   48

  20030404_20030615.adf.unw   72

  20030404_20030709.adf.unw   96

  20030404_20030802.adf.unw  120
The phase reference point region is
centered at range pixel 148, line 304 in the
interferogram stack. The reference region is 8 x 8 in
size.
DESCRIPTION
stacking
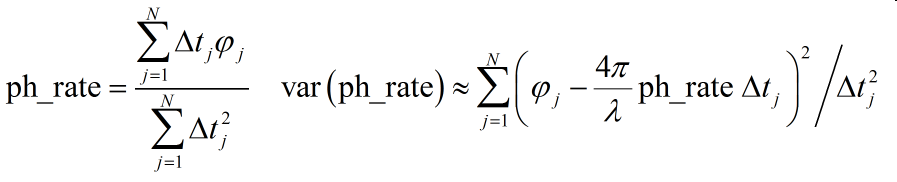
The individual interferogram phases are weighted by the time
interval in estimating the phase rate (ph_rate). The underlying assumption
is that atmospheric statistics are stationary for the set of N
interferograms. The formulas for the estimated phase rate and the
varience for each point in the image are given by:
where the time interval for each interferogram is delta_t. The phase rate can be converted to deformation rate using the program dispmap.
The phase measurments are relative to a spatial reference
point as specified on the command line. Each interferogram
has its own phase offset that is determined by averaging
interferogram values about the reference point. The size of the
reference region is also specified on the command line in terms
of width and height. This offset is subtracted from the
phase values used in estimating the deformation rate.
Typically the error of the phase rate will increase with
increasing distance from the the reference point as the
contribution of the phase errors due to atmosphere and baseline
error increases. All differential phases are estimated
relative to the reference point.
The user can specify the minimum number of interferograms with
valid phase values that are required to estimate the phase. The
default value for np_min is conservatively set
by default to the number of interferograms in the diff_tab. Setting a lower threshold
value for np_min
increases the coverage for the ph_rate estimates because each
nterferogram may not have been entirely unwrapped.
The user can select the time scale for the output to be either
days or years using the tscale parameter
SEE ALSO: