ANSI-C programs: vu_disp.c
NAME
vu_disp - Display point deformation time-series using a raster
image for point selection
SYNOPSIS
vu_disp <plist> <pmask> <pSLC_par>
  <itab> <pdisp> <pdef> <pdhgt>
  <psigma> <pmap> <ras> [ymin] [ymax] [mag]
  [win_sz]
| <plist> | (input) point list (int) |
| <pmask> | (input) point data stack of mask values (uchar, set to - to accept all points) |
| <pSLC_par> | (input) stack of SLC/MLI parameters (binary) |
| <itab> | (input) table associating interferogram stack records
with pairs of SLC stack records (ascii) (line entries are: pSLC_rec1 pSLC_rec2 pINT_rec switch_flag) |
| <pdisp> | (input) displacement (m) for each point and each layer in the stack (float) |
| <pdef> | (input) point data stack of linear deformation rate (m/year, float) |
| <pdh> | (input) point data stack of height correction value (m, float) |
| <psigma> | (input) point data stack of phase standard deviation from fit (float) |
| <pmap> | (input) point positions in map proj. coord. (easting, northing or lat,lon) (enter - for none) (float) |
| <ras> | (input) raster reference image with PT locations marked (SUN *.ras, or BMP *.bmp) |
| [ymin] | (input) plot display minimum (enter - for default = -0.03) |
| [ymax] | (input) lot display maximum (enter - for default = +0.03) |
| [mag] | zoom magnification factor (default=3) |
| [win_sz] | zoom window size before magnification (default=128) |
EXAMPLE
vu_disp pt_1.6  pmsk2 pSLC_par itab
  pdisp_los3  pdef2  phgt3 psigma2 -
  pdef3.ras  -.06 .06
Displays the deformation of data in the slant range SAR geometry. The user selects points displayed in the image pdef3.ras and the deformation history is shown in a plot window. If the user depressess the write point button the the plot and deformation data are saved to files p*.txt and p*.jpg where * is the point number.
vu_disp pt_1.6_utm.coord pmsk2 pSLC_par itab pdisp_los3
pdef2 phgt3 psigma2 pt_1.6_utm pdef3_utm.ras -.06
.06
Displays the deformation histories of individual points in the map UTM geometry using xmgrace. The user selects points displayed in the image pdef3_utm.ras and the deformation history is shown in a plot window. If the user depressess the write point button the the plot and deformation data are saved to files p*.txt and p*.jpg where * is the point number. The easting and northing of the points stored in the file p_1.6_utm is added to the annotation both in the plot and in the txt file.
INSTALLATION
The Gnuplot program must be installed (version > 4.4, 4.6 preferred) to support plot generation.
DESCRIPTION
Plots the deformation time series of points selected using a reference image. The reference image is in Sun raster or BMP format with the points marking the pixels contained in the point list. The user can select a points for analysis by clicking them with mouse button 1. The point closest to the clicked location is selected if it is closer than 5 pixels.
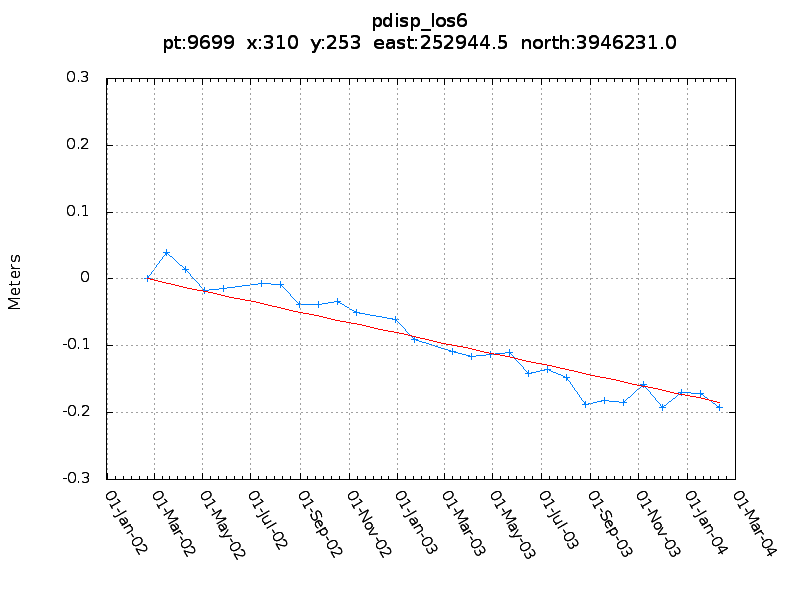
The coordinates of the point, both in the reference image on the screen, and in the point list are then displayed in the application window. Deformation values are plotted versus delta-time in the Gnuplot plot window, where the delta-time values have been calculated from the SLC parameter data and interferogram table (itab) files. The values of the linear deformation rate, height , and northing and easting of the point, and the deformation history are displayed in the terminal window.
By depressing the write point button in the display window the user can store the point deformation history, annotation, and a PNG format image of the plot. Below is an example of the text file output for a single point. At the beginning are the important parameters for the point location and altitude given in keyword:value format. The deformation history is written out in 4 columns:
file: p9699.txt |

SEE ALSO
dispmap_pt, vu_disp2d