ANSI-C programs: vu_disp2d.c
NAME
vu_disp2d - Display deformation time-series using a raster image
for position selection>
SYNOPSIS
vu_disp2d <TS_tab> <MLI_tab> <itab_ts>
  <ref_image> [DEM_par] [scale] [ymin] [ymax] [ylabel]
  [plabel] [mag] [win_sz]
| <TS_tab> | (input) list of unwrapped phase or displacement files in the time-series (text)"); |
| <MLI_tab> | (input) list MLI images and parameter files that are
associated with the entries of the DISP_tab NOTE: the number of range and azimuth looks must match the values used for the interferograms |
| <itab_ts> | (input) single-reference itab describing files in the DISP_tab time-series (text) |
| <ref_image> | (input) reference image for selecting the location to extract the time-series data for the plot (SUN *.ras, or BMP *.bmp) |
| [DEM_par] | (input) DEM parameter file describing input images when
input data are geocoded into map geometry (enter - for
none) NOTE: When the DEM_par is not provided, the data are assumed to be in slant-range geometry described in the MLI parameter files |
| [scale] | deformation scale factor (enter - for default: 1.0) |
| [ymin] | plot display minimum (enter - for default: -0.1) |
| [ymax] | plot display minimum (enter - for default: -0.1) |
| [ylabel] | label for plot y-axis (enter - for default: "Data") |
| [plabel] | plot label (enter - for default: TS_tab) |
| [mag] | zoom magnification factor (default: 2) |
| [win_sz] | zoom window size before magnification (default:192) |
EXAMPLE
vu_disp2d disp_tab2 RMLI_tab itab_ts
  diff2_ts/diff2_ts_012.bmp - 1.0 -50 50 "Unwrapped Phase" "Lost
  Hills"
Displays the deformation of data in the slant range SAR
geometry. The user selects location using the raster image
diff2_ts/diff2_ts_012.bmp. Clicking on a point
in the raster image selects a pixel location in the stack of
images listed in disp_tab2. The RMLI_tab contains the names of
the MLI images with the temporal and geometrical information
describing the interferograms. The itab_ts describes the output
interferograms in the stack and references the entries in the
RMLI_tab. The user has selected a data scale factor of 1.0 and
the y-axis bounds are from -50 to 50. The y-axis label is
specified as"Unwrapped Phase". If the user had specified a DEM
parameter file, then the data are assumed to be geocoded in the
map projection parameters in the DEM_par. When the DEM_par
is specified, the map coordinates for the pixel location are
calculated and displayed.
INSTALLATION
The Gnuplot program must be installed (version 4.6
preferred) to implement plotting.
DESCRIPTION
This program is used
primarily to display time-series data produced by the program
mb. The
output of mb is a
stack of continuous 2D images in float format. Using vu_disp2d the user can select a
location in the image stack, extract the values from all the
files in the stack at that location and plot them on the screen.
Gnuplot is used to do the actual plotting. The user has the
option to perform a linear fit of the times series data. The
parameters of the fit and the line are also included in the
plot.
The user can save the plot and a text file containing the time-series by depressing the write point button. The linear fit can be disabled by deselecting the linear regression check box. The user can specify the minimum and maximum deformation plot bounds, y-axis label, and the size and magnification of the zoom window by entering the appropriate parameters on the command line.
By clicking the write point button the user can store the point deformation history, annotation, and a PNG format image of the plot. The columns of the deformation history text file are:
Parameters such as location and geographic coordinates (if available) are annotated using keyword: value format.
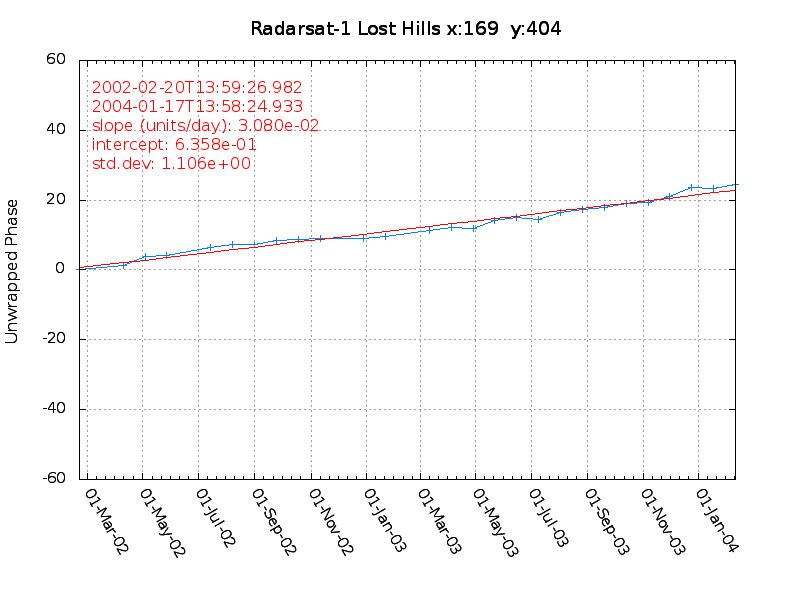
| filename:
p169_404.txt x_pixel: 169 y_pixel: 404 Radarsat-1 Lost Hills slope (units per day): 3.0799e-02 intercept (dt=0.0): 6.3578e-01 std. deviation: 1.1061e+00 0 2002-02-20T13:59:26.982 11738.582951 0.000000 1.00000e-12 6.35784e-01 1 2002-04-09T13:59:22.914 11786.582904 47.999953 1.31599e+00 2.11414e+00 2 2002-05-03T13:59:23.413 11810.582910 71.999959 3.75701e+00 2.85331e+00 3 2002-05-27T13:59:20.941 11834.582881 95.999930 4.25602e+00 3.59249e+00 4 2002-07-14T13:59:19.202 11882.582861 143.999910 6.54857e+00 5.07084e+00 5 2002-08-07T13:59:15.396 11906.582817 167.999866 7.26044e+00 5.81002e+00 6 2002-08-31T13:59:14.404 11930.582806 191.999854 7.28376e+00 6.54919e+00 7 2002-09-24T13:59:12.964 11954.582789 215.999838 8.37955e+00 7.28837e+00 8 2002-10-18T13:59:11.955 11978.582777 239.999826 8.77419e+00 8.02755e+00 9 2002-11-11T13:59: 9.895 12002.582753 263.999802 8.97837e+00 8.76672e+00 10 2002-12-29T13:58:59.573 12050.582634 311.999683 8.97837e+00 1.02451e+01 11 2003-01-22T13:58:56.732 12074.582601 335.999650 9.63748e+00 1.09842e+01 12 2003-03-11T13:58:56.559 12122.582599 383.999648 1.12571e+01 1.24626e+01 13 2003-04-04T13:58:52.595 12146.582553 407.999602 1.21626e+01 1.32018e+01 14 2003-04-28T13:58:49.260 12170.582515 431.999563 1.18359e+01 1.39410e+01 15 2003-05-22T13:58:50.798 12194.582532 455.999581 1.40918e+01 1.46801e+01 16 2003-06-15T13:58:48.641 12218.582507 479.999556 1.51173e+01 1.54193e+01 17 2003-07-09T13:58:42.132 12242.582432 503.999481 1.45317e+01 1.61585e+01 18 2003-08-02T13:58:42.671 12266.582438 527.999487 1.65434e+01 1.68977e+01 19 2003-08-26T13:58:41.441 12290.582424 551.999473 1.72960e+01 1.76368e+01 20 2003-09-19T13:58:39.028 12314.582396 575.999445 1.78802e+01 1.83760e+01 21 2003-10-13T13:58:36.515 12338.582367 599.999416 1.89139e+01 1.91152e+01 22 2003-11-06T13:58:34.050 12362.582339 623.999387 1.92745e+01 1.98544e+01 23 2003-11-30T13:58:33.236 12386.582329 647.999378 2.10588e+01 2.05935e+01 24 2003-12-24T13:58:30.593 12410.582299 671.999347 2.37051e+01 2.13327e+01 25 2004-01-17T13:58:24.933 12434.582233 695.999282 2.32299e+01 2.20719e+01 26 2004-02-10T13:58:22.598 12458.582206 719.999255 2.44224e+01 2.28111e+01 |
The plot produced from this data is shown below:
SEE ALSO
dispmap_pt, vu_disp, mb